
DRAFT — under teacher review.
IPO Charts — Process Means Steps, Not the Answer
The Hamilton and Alexandra College · Year 12 · 2026
An IPO chart has three columns — Input, Process, Output — and you write one chart per process. The big idea in C05: your DFD tells you what the charts are. Every process in your data flow diagram becomes one IPO chart, and the data flowing in and out of it becomes the Input and Output columns.
The trap that caps students at the 5–6 band is writing the Process column as an outcome instead of as steps. This page shows what that looks like, how your DFD feeds your charts, and a full worked example.
The core rule
Process = the steps that turn input into output. If your Process cell could just as easily be your Output cell, it is wrong.
The three columns do different jobs:
- Input — the data entering the process. Read these straight off your DFD.
- Process — the steps or calculations performed on those inputs: in general terms, how the input becomes the output.
- Output — the data the process produces. Also read off your DFD.
Video 1 — What is an IPO chart?
🎯 Watch for: how every row pairs a piece of input with the processing that acts on it — and how the Process column always describes an action, never just a result.
This video is from an AU teacher pitched at NSW HSC Software Design & Development. The IPO concept is identical to VCE — just note the course name is different.
Check Your Understanding
A login screen has an IPO chart. For each item, decide which column it belongs in — Input, Process, or Output:
- The username and password typed in by the user.
...
Input — data entering the process.
- Compare the entered password with the stored password and set a valid/invalid flag.
...
Process — a step performed on the input.
- An "Access granted" or "Access denied" message on the screen.
...
Output — the result the process produces.
The big idea: from DFD to IPO
Your data flow diagram already did the hard part. Each process in the DFD becomes its own IPO chart:
- the arrows flowing in → the Input column
- the process itself → the Process column (the steps)
- the arrows flowing out → the Output column
🎯 Watch for: how a single process from a DFD is turned into one IPO chart, with the data flows becoming the Input and Output rows.
Here is a DFD for a simple login system:
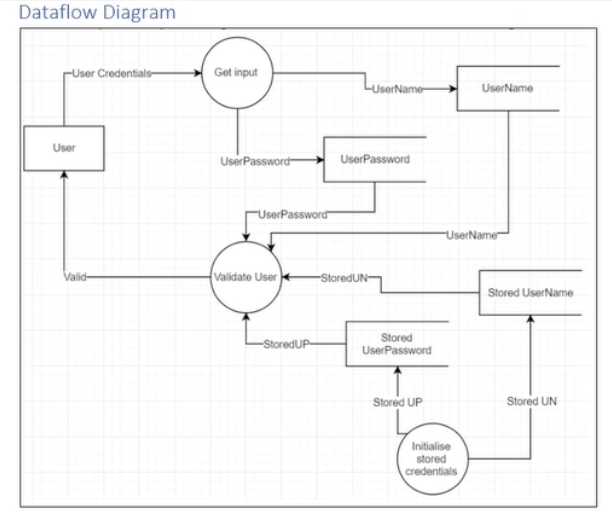
Each process in that diagram becomes one IPO chart. Start with the general shape:
(template) Name of the process
| Input | Process | Output |
|---|---|---|
| List the inputs as per the DFD | Explain, in general terms, how the processing/calculations convert the input to the output | List the outputs as per the DFD |
Now the three real processes from the DFD above.
DFD process: Get Input
| Input | Process | Output |
|---|---|---|
| Two separate strings keyed in by the user. | Prompt the user for their username, then store the response in the UserName variable.Prompt the user for their password, then store the response in the UserPassword variable. |
Entered string written to UserName.Entered string written to UserPassword. |
DFD process: Initialise Stored Credentials
| Input | Process | Output |
|---|---|---|
| (none — the values are hardcoded) | Write the hardcoded value into the StoredUN variable.Write the hardcoded value into the StoredPW variable. |
StoredUNStoredPW |
DFD process: Validate User
| Input | Process | Output |
|---|---|---|
UserNameStoredUNUserPasswordStoredPW |
Set a bValid boolean to False.Compare UserName with StoredUN.IF UserName = StoredUN THEN compare UserPassword with StoredPW.IF those ALSO match THEN set bValid to True. |
bValid |
The Process column for Validate User lists the actual decision steps — not just "check the login". That is what scores in the upper bands.
Wrong vs Right
The same process, written two ways:
| Input | Process | Output | |
|---|---|---|---|
| ❌ Wrong | UserName, StoredUN, UserPassword, StoredPW |
Check the login | bValid |
| ✅ Right | UserName, StoredUN, UserPassword, StoredPW |
1. Set bValid = False. 2. Compare UserName with StoredUN. 3. If equal, compare UserPassword with StoredPW. 4. If both match, set bValid = True. |
bValid |
- "Check the login" just restates the goal — it shows none of the logic.
- The Right version shows each comparison and decision. A marker can only credit logic that is visible.
Common mistakes
Mistake 1: Process that copies the Output
"Work out whether the login is valid."
That is the Output column repeated. Replace it with the numbered decision steps.
Mistake 2: Missing the decision branches
"Compare the username and password."
If there is an IF in the logic, the steps must show what happens on each branch — set the flag True only when both match.
Mistake 3: Inputs not traced to the DFD
Every input in an IPO chart should be a data flow you already drew in your DFD. An input that appears from nowhere is a consistency error the marker will notice.
Mistake 4: One IPO chart for everything
Write one chart per process. Each DFD process has its own inputs, logic and outputs — cramming them together makes the Process column vague by design.
Check Your Understanding
- Where do the Input and Output columns of an IPO chart come from?
...
From your DFD — the data flowing into a process becomes the Input column, and the data flowing out becomes the Output column. The IPO chart details the process in between.
- A student writes Process = "display the total price". What is wrong, and how should they fix it?
...
"Display the total price" names the output, not the steps. Replace it with the operations: e.g. 1. Retrieve unit price and quantity. 2. Multiply them for the subtotal. 3. Add GST. 4. Display the result. The Process column must show the how.
Credits
- Login-system DFD — supplied for The Hamilton and Alexandra College SD course.
See also
- VCAA Pseudocode — Not Python — turn each IPO Process column into formal pseudocode
- Data Dictionary
- Sketch vs Mock-up
← Back to C05 Home · VCE Software Development Hub